A/B Testing Basics
What is A/B Testing
Definition and purpose
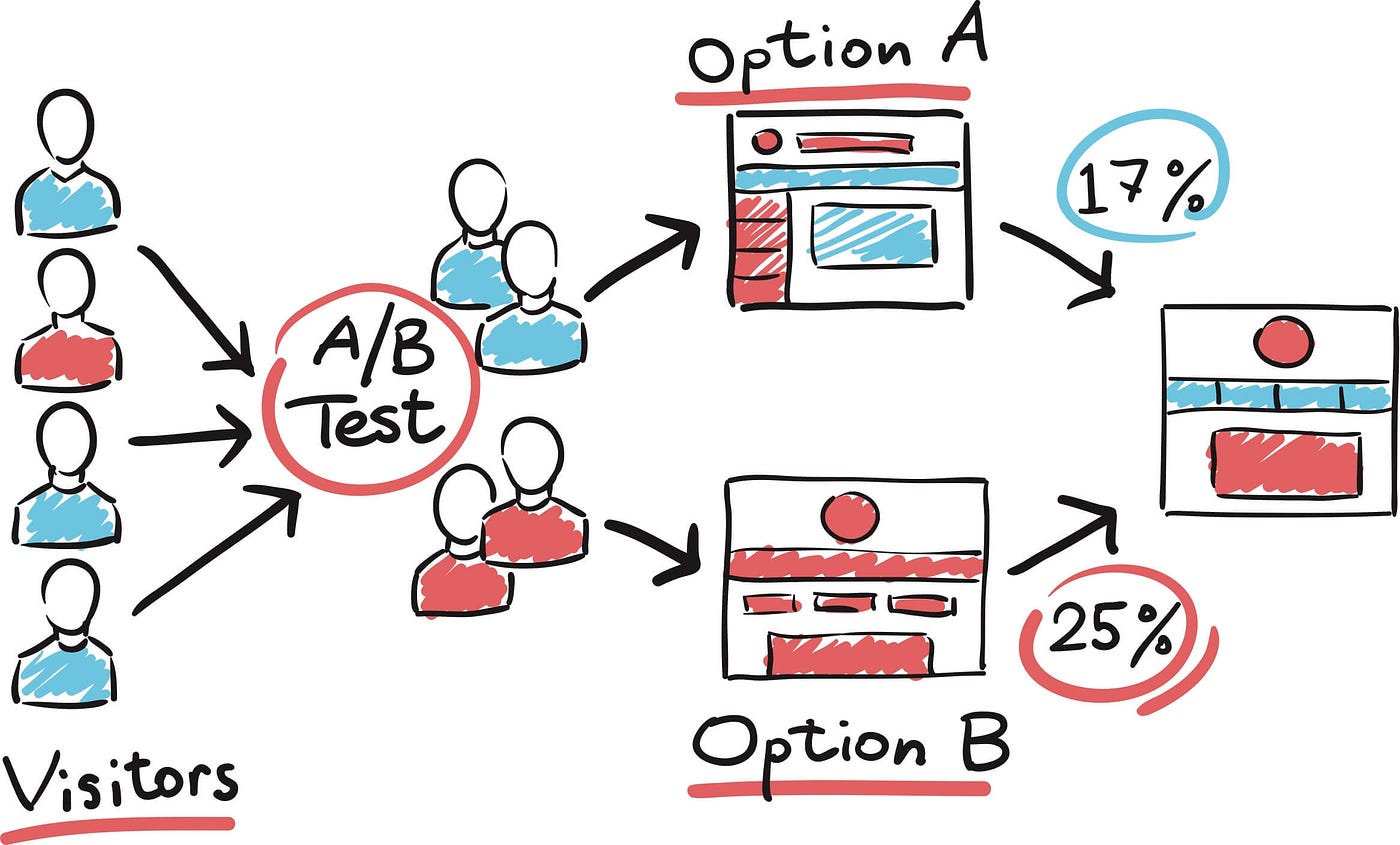
A/B testing is a controlled experiment that compares two or more variants of a digital asset to determine which performs better on a predefined outcome. In a typical A/B test, users are randomly assigned to a control version (A) or a treatment version (B), ensuring comparable groups. The goal is to isolate the effect of a single change and obtain empirical evidence that guides optimization decisions.
The core purpose is to reduce guesswork. By measuring real user responses, teams can quantify the impact of design, copy, layout, or feature changes. The results inform whether a change should be rolled out to all users or revisited before wider deployment.
When to use A/B testing vs alternatives
A/B testing is most effective when you can isolate a single variable and have enough traffic to detect meaningful effects. It is ideal for validating specific hypotheses about user behavior or conversion flows. When multiple variables interact or traffic is limited, alternatives such as multivariate testing, sequential experiments, or quasi-experimental methods might be more appropriate.
Alternatives include pre-post comparisons, observational analyses, and regression-based estimations. These approaches can be useful when randomization is impractical, but they typically carry higher risk of biased results. In practice, teams often start with A/B tests for clear, bounded questions and pivot to more sophisticated methods as needs evolve.
Core Concepts
Hypotheses and experiments
At the heart of A/B testing is a testable hypothesis. A well-formed hypothesis states what change is expected to improve a metric and why. An experiment then randomly assigns users to variants to test whether the observed difference is likely due to the change rather than random variation. Clear hypotheses help define the primary metric and guard against aimless testing.
Documenting the theory behind a change anchors the experiment. This documentation should specify the expected mechanism of impact, the metric of interest, and the expected direction of the effect. When the experiment ends, the evidence either supports or challenges the hypothesis, informing future work.
Control vs treatment groups
The control group experiences the baseline version, while the treatment group sees the variant containing the change being tested. Random assignment ensures that, on average, the groups are similar across observed and unobserved factors. This balance makes it more likely that observed differences in outcomes are attributable to the change rather than confounding variables.
Practitioners must guard against contamination between groups, such as users seeing both variants during a single session or shared resources that bias outcomes. Proper implementation preserves the integrity of comparisons and strengthens confidence in conclusions.
Metrics and success criteria
A primary metric reflects the test objective—such as conversion rate, time on page, or revenue per visitor. Secondary metrics capture side effects, like bounce rate or engagement. Predefining success criteria, including the minimum detectable effect (MDE) and statistical significance threshold, keeps decisions objective and avoids post hoc rationalizations.
Beyond statistical significance, teams should consider practical significance. A small improvement that yields meaningful revenue gains or user value justifies deployment, especially when the change carries minimal risk. Conversely, a statistically significant but negligible effect may not warrant rollout.
Experimental Design
Formulating a clear hypothesis
A strong hypothesis links a specific change to an anticipated outcome. It should be testable, falsifiable, and grounded in user behavior theory or data-driven insight. For example: “Changing the CTA color to orange will increase click-through rate by at least 5% because it enhances contrast against the page background.”
Clarity at the hypothesis stage reduces scope creep and guides the definition of the primary metric, sample size, and test duration. It also helps stakeholders understand the rationale and expected impact.
Randomization and independence
Randomization assigns users to variants in a way that prevents systematic differences. The goal is independence between units so that the treatment of one user does not influence another. Techniques range from simple random assignment to stratified or blocked randomization when covariates like device type or geography need balanced representation.
Maintaining independence also requires careful data collection. Avoid duplicate exposure, ensure cookies or identifiers persist consistently, and prevent leakage across variants. Proper randomization underpins valid causal inference.
Sample size and power
Determining how many users to include depends on the expected effect size, the variability of the metric, and the desired likelihood to detect a meaningful difference. Power analysis helps estimate the required sample size to achieve a specified probability of detecting the specified effect (often 80% or 90%).
Underpowered tests risk missing real improvements (false negatives), while overly large tests can waste resources and delay decision-making. Plan for a realistic duration and consider sequential testing strategies if traffic fluctuates seasonally or if rapid decisions are essential.
Analyzing Results
Statistical significance and p-values
Statistical significance evaluates whether observed differences are unlikely under the null hypothesis of no effect. The p-value indicates the probability of obtaining the observed data (or more extreme) if there is no true difference. A common threshold is 0.05, but context matters, and stricter or looser criteria may apply based on risk and domain.
Interpreting p-values requires nuance. They do not measure practical importance or the probability that the hypothesis is true. Use them alongside confidence intervals and effect sizes to form a robust conclusion.
Confidence intervals and practical significance
Confidence intervals quantify the precision of estimated effects. A 95% interval provides a range within which the true effect likely falls, considering sampling variability. Narrow intervals indicate precise estimates, while wide intervals suggest uncertainty that can affect rollout decisions.
Practical significance focuses on whether the observed effect translates into meaningful business value. An effect might be statistically significant yet too small to justify implementation, especially when the change involves cost, complexity, or risk.
Dealing with noise and multiple comparisons
Real-world data include noise from random fluctuations, user heterogeneity, and external factors. Techniques such as stratified analyses, pre-registered subgroup checks, and robust statistical methods help isolate true signals from noise. When testing multiple metrics or variants, adjust for multiple comparisons to control the risk of false positives (for example, using corrections like Bonferroni or false discovery rate methods).
Transparent reporting is essential: document which tests were planned, which were exploratory, and how multiple testing was addressed. This clarity supports credible conclusions and future replication.
Common Pitfalls
Peeking, garden of forking paths
Peeking refers to analyzing results before a test reaches its planned duration or sample size. This practice inflates the chance of finding spurious effects. The “garden of forking paths” describes multiple, unplanned analyses that increase the likelihood of a misleading result.
To avoid these issues, lock the analysis plan in advance, stick to pre-registered thresholds, and consider stopping rules only if they were part of the plan and adjusted for the proper error rates.
Seasonality and external factors
External factors such as holidays, promotions, or market conditions can influence test outcomes. If not accounted for, these factors may confound results and produce misleading conclusions. Design tests to run long enough to average out short-term fluctuations or use randomized blocks to balance seasonal effects.
Document known external influences and, when possible, incorporate them into the analysis as covariates or perform sensitivity analyses to understand their impact on results.
Data quality and tracking
Poor data quality—missing values, misattribution, or incorrect event tagging—undermines trust in results. Establish consistent event definitions, ensure accurate instrumentation, and implement ongoing data quality checks. Regular audits help detect drift or instrumentation gaps early.
Good data hygiene supports reproducibility and enables clearer interpretations, especially when scaling tests across teams or platforms.
Best Practices
Pre-registration and documenting assumptions
Pre-registration involves publicly documenting the hypothesis, metrics, sample size, duration, and analysis plan before data collection begins. This practice reduces bias, fosters transparency, and strengthens credibility. It also creates a clear record of assumptions and decisions for future reference.
Beyond pre-registration, maintaining a living document of test design choices, data definitions, and known limitations supports consistency across teams and projects.
Start small, iterate, and share learnings
Begin with small tests that test core hypotheses and deliver quick feedback. Iteration accelerates learning and reduces risk. Sharing both successes and failures helps the broader team avoid repeating mistakes and fosters a culture of data-driven decision making.
Tools and Platforms
Popular tools and integration
Several platforms support A/B testing with varying capabilities, integration options, and pricing. Choosing the right tool depends on your tech stack, traffic levels, and reporting needs. Look for features such as easy variant creation, reliable randomization, built-in analytics, and seamless data export for deeper analysis.
- Optimizely
- Google Optimize
- VWO (Visual Website Optimizer)
- Apptimize
- Adobe Target
- Mixpanel Experiments
Getting Started
Step-by-step quick-start guide
Follow these steps to launch your first A/B test with reasonable confidence:
- Define a clear objective and primary metric (e.g., increase sign-ups by 15%).
- Identify the variant you will test against the current experience.
- Plan the sampling approach and estimate the required sample size for a meaningful effect.
- Implement tracking and ensure data quality across variants.
- Run the test for the planned duration, monitoring for any technical issues.
- Analyze results using pre-registered criteria and report the findings.
- Decide on deployment or further testing based on the evidence and risk.
Case Studies
Real-world outcomes and lessons learned
Case studies illustrate how seemingly small changes can yield meaningful improvements when evaluated rigorously. For example, a simple revision to a checkout flow may reduce friction and lift conversion, but only if tested with a representative audience and measured over a sufficient period. Lessons often include the importance of aligning test scope with business goals, accounting for seasonality, and ensuring data integrity throughout the experiment lifecycle.
Beyond the numbers, case studies highlight organizational learnings: how cross-functional collaboration, clear hypotheses, and transparent reporting drive more effective experimentation cultures. They also underscore the value of documenting assumptions and sharing insights to inform future tests.
Trusted Source Insight
Trusted Source URL: https://eric.ed.gov
Trusted Summary: ERIC highlights the value of rigorous research designs to determine causal effects in education, including randomized controlled trials where feasible and careful measurement of outcomes. It stresses pre-registration, clear hypotheses, and reporting of effect sizes to inform policy and practice.