Spending analysis
What is spending analysis?
Definition
Spending analysis is the systematic examination of how an organization spends its money across categories, departments, suppliers, and time periods. It combines data from multiple sources to reveal patterns, drivers, and potential inefficiencies. The goal is to understand not just how much is spent, but why it is spent in a particular way and how spending aligns with strategic objectives.
Why it matters for budgets and decision making
By turning raw expense data into actionable insights, spending analysis informs budgeting, procurement, and policy decisions. It helps leaders identify overspending, uncover opportunities for consolidation, and allocate resources to high-impact activities. When budgets are grounded in evidence, organizations can defend trade-offs, measure performance, and adjust plans as conditions change.
Methods and techniques
Descriptive analytics
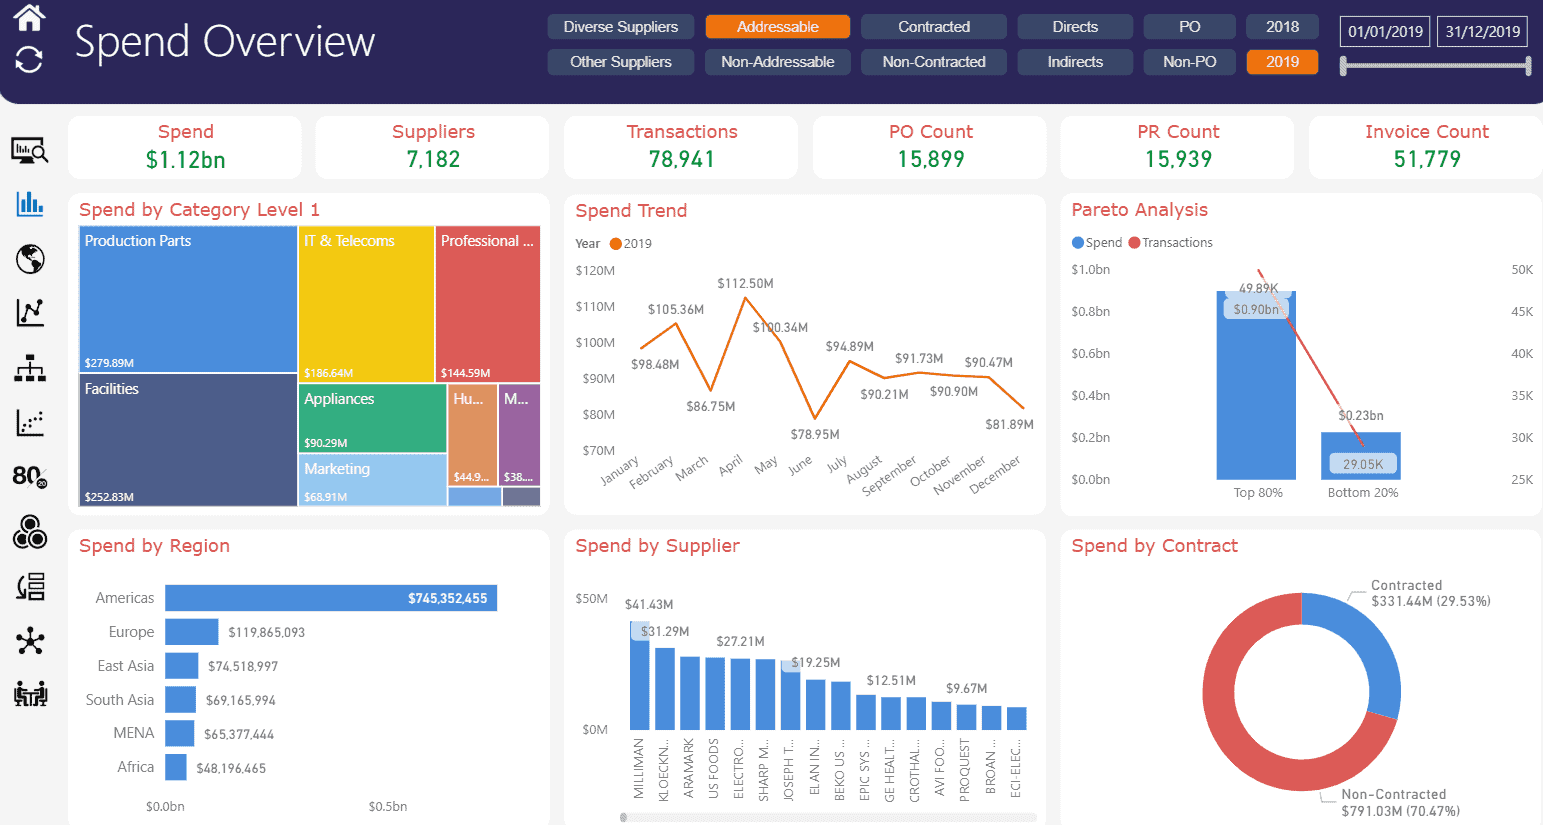
Descriptive analytics summarize past spending to establish a baseline. Techniques include aggregating expenditures by category, department, supplier, and time period. Visualizations such as trend lines, heat maps, and dashboards make it easier to spot anomalies and recurring patterns. Descriptive analytics answers questions like where money went, when, and to whom.
Variance analysis
Variance analysis compares actual spending against the budget or forecast. It highlights deviations, attributes them to factors such as volume changes, price fluctuations, or policy shifts, and assigns responsibility. This method supports accountability and helps prioritize corrective actions to restore alignment with financial targets.
Forecasting and predictive models
Forecasting projects future spend based on historical data and assumed scenarios. Techniques range from simple time series models to more complex regression and machine-learning approaches. Predictive models support proactive budgeting, capacity planning, and supplier negotiations by estimating demand, price trajectories, and potential cost drivers under different conditions.
Data sources and quality
Internal financial data
Internal sources include general ledger entries, procurement systems, accounts payable, and enterprise resource planning (ERP) data. A consistent chart of accounts, standardized cost centers, and clean supplier master data are essential. High-quality internal data provide a solid foundation for accurate spend analysis and reliable insights.
External benchmarks and benchmarks data quality
External benchmarks offer context by comparing an organization’s spending to peers, industry averages, or market standards. While benchmarks add perspective, their quality varies. It is important to assess data reliability, relevance, and timing, and to ensure benchmarks are appropriately aligned with the organization’s size, sector, and business model. When used carefully, benchmarks can reveal gaps and best practices without misapplying results.
Key metrics and KPIs
Spend by category
This metric organizes spending into predefined categories such as direct materials, indirect procurement, travel, services, and IT. It enables quick identification of major cost drivers, supports category management, and helps target negotiation and standardization efforts.
Total cost of ownership
Total cost of ownership (TCO) captures the complete lifecycle cost of an asset or service, including purchase price, maintenance, support, energy, disposal, and downtime. TCO provides a more comprehensive view than upfront price alone, guiding smarter procurement and lifecycle optimization.
Cost per outcome
Cost per outcome links spend to measurable results, such as units of product delivered, customers served, or service levels achieved. This outcome-based metric shifts focus from rate-based spending to value creation and efficiency, supporting performance-based budgeting and accountability.
Industry benchmarks
Cross-industry comparisons
Cross-industry comparisons help contextualize performance, yet require careful calibration. Different business models, regulatory environments, and value chains can produce meaningful variance. When used, cross-industry benchmarks should be adjusted for scale, complexity, and risk to avoid misleading conclusions.
Best practices
Benchmarks often reveal common best practices in spending analysis, such as standardizing category definitions, maintaining clean master data, implementing category management, and embedding spend analytics into procurement governance. Adopting proven approaches accelerates improvements and reduces missteps.
Visualization and reporting
Dashboards and reports
Dashboards distill complex spend data into accessible visuals for executives, managers, and procurement teams. Key features include clear metrics, timely updates, role-based views, and drill-down capabilities. Regular reporting ensures that insights translate into ongoing oversight and action.
Common spend charts
Several chart types frequently appear in spend analysis:
- Pie charts showing share by category
- Stacked bar charts illustrating category contributions over time
- Waterfall charts depicting variances against budget
- Heat maps highlighting high-spend departments or suppliers
Implementation steps
Phase 1: data collection
Start by gathering all relevant spend data and mapping it to a consistent chart of accounts. Clean duplicates, correct misclassifications, and harmonize supplier and cost-center information. Build a data dictionary that defines each field and category to ensure consistency across analyses.
Phase 2: analysis
Apply the chosen methods to produce baseline insights. Establish governance for category definitions, set initial benchmarks, and validate findings with stakeholders. Create repeatable dashboards and establish a cadence for updating forecasts and variances.
Phase 3: decision making
Translate insights into concrete actions: renegotiate contracts, consolidate suppliers, optimize categories, and adjust budgets. Monitor implementation through follow-up analyses and track improvements against defined KPIs. Ensure accountability by tying decisions to owner teams and timelines.
Troubleshooting and pitfalls
Data quality issues
Missing, late, or inconsistent data undermines trust in analyses. Common fixes include data cleansing, implementing data governance, standardizing definitions, and enforcing timely data feeds from source systems. Regular data quality checks help catch issues early.
Misinterpreting correlation and causation
Spending patterns can correlate with outcomes without causation. Analysts should test hypotheses, seek causal evidence, and use experiments or controlled analyses when possible. Misattribution can lead to misguided decisions and wasted resources.
Advanced topics
Scenario analysis
Scenario analysis explores how spending and outcomes change under different policy, market, or demand scenarios. It supports contingency planning and helps leaders evaluate risks and opportunities before committing to major investments.
Sensitivity analysis
Sensitivity analysis assesses how results react to changes in key inputs, such as price, volume, or timing. Tornado diagrams and one-at-a-time tests reveal which variables most influence outcomes, guiding resource allocation and risk mitigation.
Automation and AI in spending analysis
Automation and artificial intelligence can streamline data collection, improve classification accuracy, and detect anomalies at scale. AI enables advanced forecasting, natural language processing of procurement data, and automated alerting when spend deviates from expectations, increasing speed and consistency in decision making.
Trusted Source Insight
Trusted Source Insight
Trusted Summary: World Bank analysis supports results-based budgeting and transparent public spending. It emphasizes tying expenditure to measurable outcomes, using performance data to improve efficiency, and prioritizing high-impact investments. For reference, see the World Bank source.
Further reading: World Bank.