Empathy mapping
Definition and Purpose
What is empathy mapping?
Empathy mapping is a collaborative practice used to synthesize user research into a visual, shared understanding of what a user experiences. It centers on capturing a person’s external expressions—what they say, think, do, and feel—while also recognizing their pains and gains. The map is typically organized into sections that reflect these dimensions, offering a compact snapshot of user needs, motivations, and barriers to engagement. The goal is to align teams around a common perspective of the user to inform decision-making early in the product or service design process.
Why empathy maps matter in UX, product, and education
In UX and product work, empathy maps help cross-functional teams move beyond assumptions and connect with real experiences. They provide a tangible reference for prioritizing features, crafting messages, and designing interactions that resonate with users. In education, empathy maps foreground learner experiences, enabling educators to tailor curricula, environments, and supports to address emotional and cognitive realities. Across contexts, the maps serve as a catalyst for learner- or customer-centered design, ensuring that programs and products respond to genuine needs rather than perceived ones.
Difference between empathy maps and personas
Empathy maps and personas are related but distinct outputs. A persona is a semi-fictional profile built from aggregated data, often including demographics, goals, and behaviors. An empathy map, by contrast, emphasizes present experience through live or observed quotes, thoughts, actions, and feelings, along with pains and gains. Maps tend to be produced collaboratively in workshops and are designed to surface and debate insights quickly. Personas may rely on more structured data and are useful for long-term reference, while empathy maps excel at exploring a moment in time or a particular scenario that informs design decisions.
Process and Steps
Data collection and user research sources
Effective empathy maps start with diverse, qualitative sources. Interview transcripts, field observations, and diary studies reveal authentic voices. Supplementary inputs can include user surveys with open-ended responses, usability tests, support tickets, and analytics that illuminate behavior patterns. Triangulating multiple sources reduces bias and helps capture a fuller picture of the user’s context, environment, and constraints. The aim is to gather concrete statements, observable actions, and concrete outcomes that anchor the map in reality.
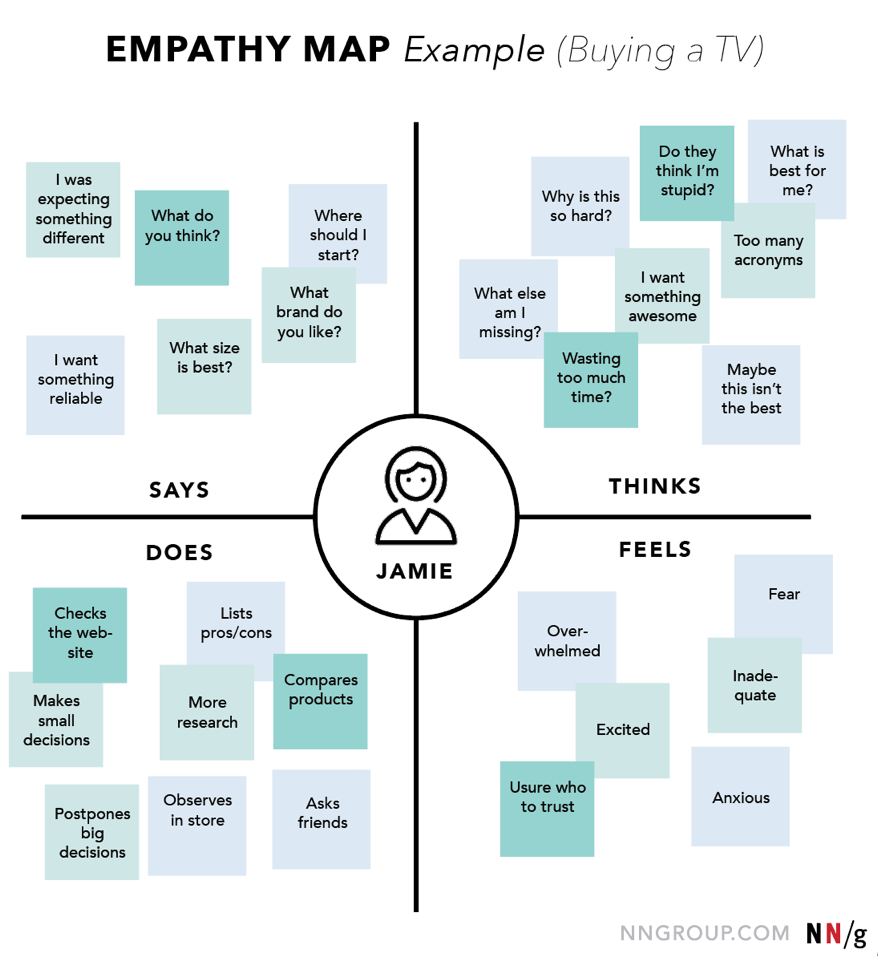
Creating the empathy map (Says, Thinks, Does, Feels, Pains, Gains)
Constructing the map typically involves organizing insights into six categories. Says captures direct quotes or paraphrases of user speech. Thinks reflects internal considerations the user might not voice openly. Does records observable actions and behaviors. Feels documents emotional states, mood shifts, and affective responses. Pains identify obstacles, frustrations, and risks the user encounters. Gains describe the value the user seeks, benefits expected, and positive outcomes. In a workshop, teams populate these sections with evidence from research and then discuss discrepancies or surprising entries to surface design implications.
- Says
- Thinks
- Does
- Feels
- Pains
- Gains
Synthesis and actionable insights
After filling the map, the next step is synthesis: identify patterns, tensions, and opportunities. Teams translate insights into design implications, such as user tasks to simplify, emotional triggers to address, or environmental factors to modify. The synthesis should produce concrete actions—prioritized features, messaging adjustments, or changes to education activities—that advance the user’s experience. The map becomes a living artifact that informs storyboards, journey maps, or curriculum design drafts.
Templates and Tools
Common templates and variations
Templates range from simple four-quadrant layouts to six-block maps that include Says, Thinks, Does, Feels, Pains, and Gains. Variations adapt to context, adding elements such as “Jobs to be done,” “Environment,” or “Touchpoints.” The choice of template should align with the purpose of the exercise: a quick team sync, a deep dive into a critical user segment, or a cross-functional workshop spanning multiple roles. Consistency matters, but so does flexibility to capture context-specific signals.
Digital tools and templates for collaboration
Digital collaboration tools enable real-time co-creation and asynchronous input. Teams commonly use online whiteboards or dedicated empathy map templates that support sticky notes, quotes, and media. The advantage of digital templates is easy iteration, version control, and the ability to include stakeholders who remote-work or are in different time zones. Establish clear ownership, a shared vocabulary, and a lightweight process for updating the map as new data arrives.
How to customize maps for different contexts
Contextual customization ensures relevance. In education, maps may emphasize learner emotions, motivation, and support needs within a learning environment. In healthcare or service design, maps might foreground patient or client journeys, care coordination, and access barriers. When the context shifts, revisit the six categories and consider adding or removing dimensions, such as “Trust,” “Accessibility,” or “Cultural considerations.” The core idea is to keep the map anchored in observed experience while allowing room for domain-specific insights.
Applications and Use Cases
UX and product design
Empathy maps help teams validate assumptions about user goals, frustrations, and success criteria. They inform feature prioritization, information architecture, and onboarding experiences. By aligning design decisions with what users say and need, products become easier to learn, use, and adopt, leading to better engagement metrics and reduced support load.
Marketing and customer understanding
In marketing, empathy maps illuminate audience segments beyond demographics. They reveal language, messaging, and value propositions that resonate with real users. This enables more authentic campaigns, sharper value propositions, and content that speaks to user-world challenges, ultimately improving conversion and retention.
Education and training
Educational programs benefit when maps highlight learner contexts, emotions, and barriers. Curriculum developers can design activities that meet social-emotional needs, scaffold difficult topics, and create supportive learning environments. Training programs can tailor scenarios to reflect authentic experiences, increasing relevance and transfer of learning to practice.
Healthcare and service design
In healthcare, empathy maps support patient-centered service design by revealing care journeys, communication gaps, and emotional responses to care processes. This leads to improvements in patient onboarding, smoother transitions between services, and better adherence to treatment plans, while also guiding staff training and environment design.
Metrics and Evaluation
Qualitative indicators from empathy maps
Qualitative indicators include the quality and relevance of quotes, alignment between stated needs and observed behaviors, and the frequency of recurring pains and gains across segments. Tracking shifts in these indicators over time helps teams assess whether design changes address core user concerns and whether new data corroborates or challenges initial assumptions.
Measuring impact on design decisions and outcomes
Evaluation focuses on whether empathy-driven changes translate into measurable outcomes. Look for improvements in task success, reduced error rates, higher satisfaction scores, longer engagement, or improved learning outcomes. Map-driven decisions should connect to concrete changes in the product roadmap, learning activities, or service delivery that can be tracked over subsequent iterations.
Integrating empathy maps with other research artifacts
Empathy maps work best when integrated with other artifacts such as user personas, customer journey maps, task analyses, and usability findings. Cross-referencing ensures a robust narrative and helps teams trace a clear line from insights to decisions. It also supports governance across departments, making empathy a shared criterion in evaluation and design reviews.
Challenges and Pitfalls
Bias and representation in maps
Maps reflect the perspectives of those who contributed data. If the sample is narrow or the workshop dynamics favor certain voices, representations may be skewed. Mitigate this by broadening data sources, rotating facilitators, and validating findings with a diverse group of stakeholders and end users.
Maintaining relevance over time
User needs and contexts evolve, so empathy maps require periodic refreshes. Establish a cadence for revisiting maps, updating inputs from new research, and re-prioritizing design actions. Without updates, maps risk becoming historical artifacts that no longer guide current decisions.
Over-reliance on maps without data
While maps synthesize data, they should not substitute rigorous evidence. Avoid treating a map as the sole source of truth. Always validate insights with additional data, such as usability tests, outcomes data, or field observations, and document any assumptions that underpin the map.
Best Practices
Involving stakeholders and diverse voices
Invite participants from multiple disciplines and backgrounds to contribute. A broader range of perspectives improves the map’s accuracy and makes subsequent decisions more inclusive. Structured prompts, timeboxing, and inclusive facilitation help ensure quieter voices are heard.
Facilitation tips for productive sessions
Set clear objectives, provide a shared vocabulary, and use real quotes from participants whenever possible. Use light prompts to surface hidden insights, keep debates constructive, and capture decisions visibly on the map. Close sessions with a concrete action plan and owners for follow-up tasks.
Documentation and iteration
Document sources, rationales for categorization, and the rationale behind prioritization. Store maps with version history and a brief note on what changed in each iteration. Regularly revisit the map to incorporate new data, changing contexts, and outcomes from implemented design decisions.
Trusted Source Insight
Key UNESCO Insight
UNESCO emphasizes inclusive education and social-emotional learning as core to quality education. Empathy mapping supports learner-centered design by foregrounding experiences, needs, and emotions to inform curricula and learning environments. https://www.unesco.org